HomeLitmus Edge Manager
Litmus Edge Manager
DISCOVER LITMUS EDGE MANAGER
Simplify Your Industrial IoT Deployments
Drive efficiency and scale with our centralized, hardware agnostic edge management platform.
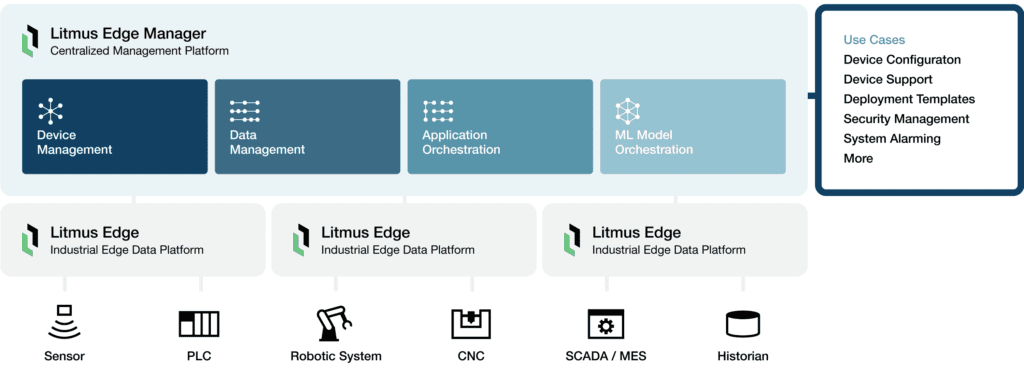
The Centralized Edge Management Platform
Why Litmus Edge Manager?
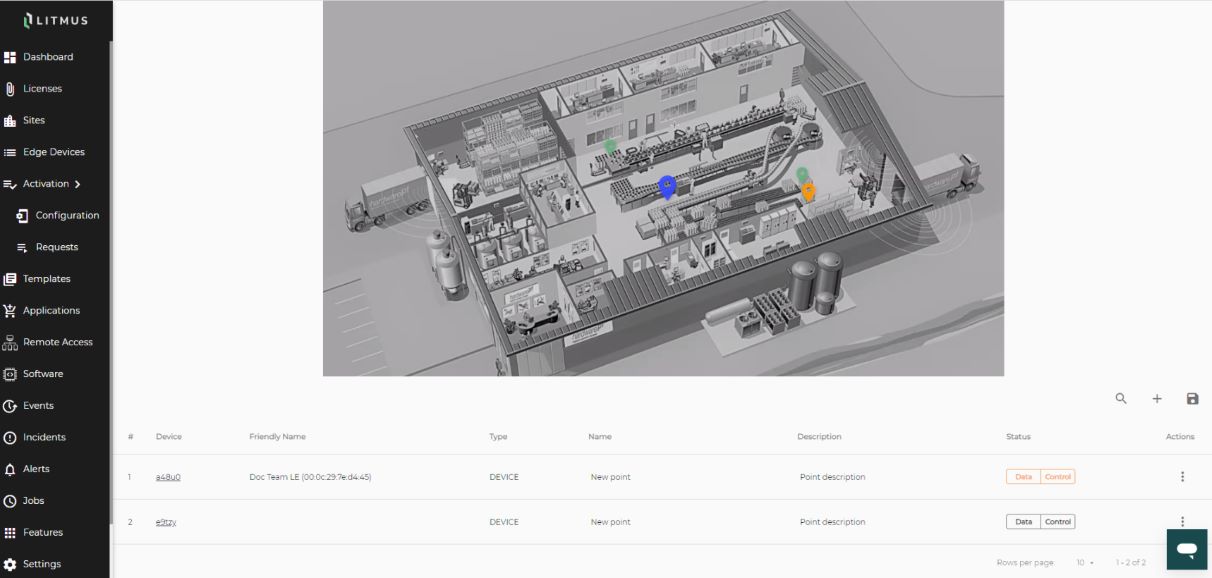
Configure and Manage Edge Devices
Edge Lifecycle Management
Set up and configure IIoT devices remotely and create templates for rapid deployment to tens or hundreds of sites. Mass provision large-scale IIoT deployments across all your sites with ease. Streamline maintenance with remote management, troubleshooting and over-the-air updates.
Scale your deployment rapidly
Use Litmus Edge Manager for end-to-end edge lifecycle management. On one centralized platform, you can do the following:
- Initial configuration and bootstrapping
- License management
- Over-the-air updates
- Configuration management
- Backup and restore
- Template management
A New Enterprise-Wide Data Store
Data Management
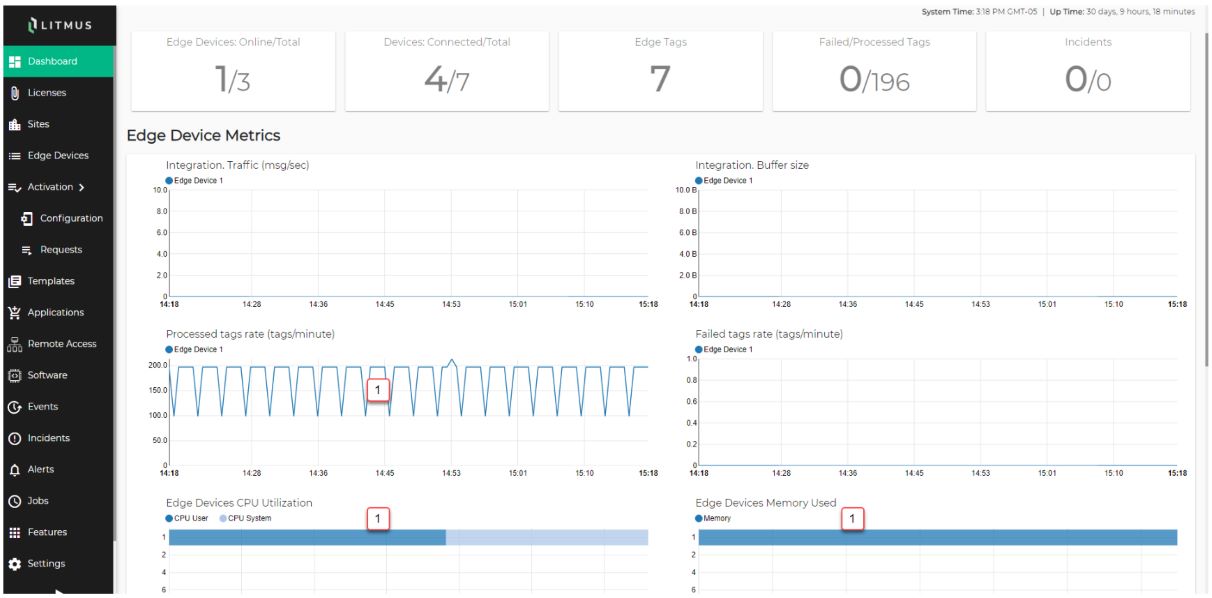
Aggregate data from multiple Litmus Edge deployments in one place and allow other applications to easily access the data. Quickly visualize real-time data across all devices and factories with configurable dashboards and KPI reports.
Aggregate Your Data Across Sites
Collect all your data across distributed sites from multiple Litmus Edge deployments in one place. Allow enterprise applications to access the data in real-time for faster time-to-value and a shared single source of truth.
Visualize on a centralized dashboard
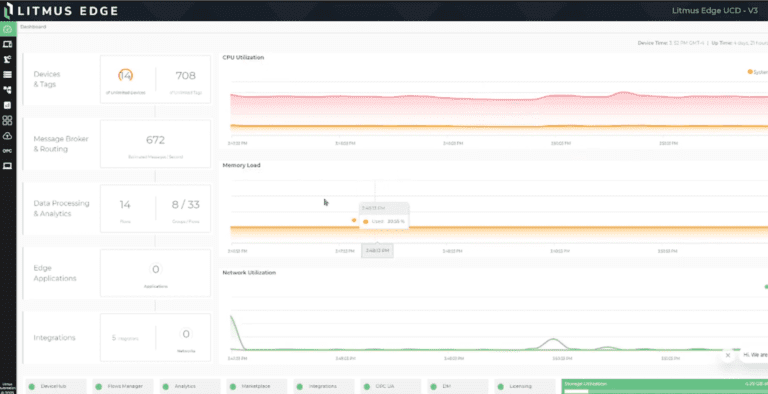
Quickly visualize real-time data across all devices and factories with configurable dashboards and KPI reports.
Launch Enterprise-Scale Applications
Application Orchestration
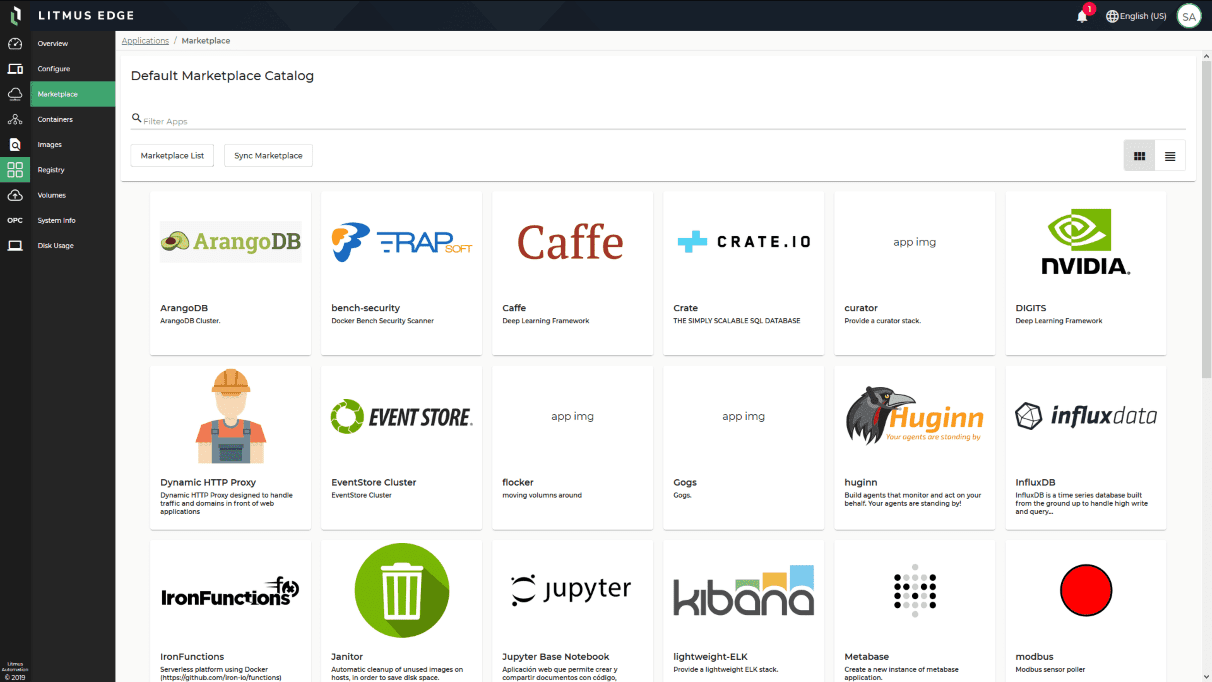
Create and customize your global application library, choose the applications that you want to deploy at a particular site and control who has access. Develop your own containerized applications and deploy, manage and update them to any number of Litmus Edge deployments.
Create uniformity among your sites
List and use applications from a centralized repository to create consistency across your sites. Simplify and streamline enterprise IT tasks related to managing various applications across multiple sites.
Storage, distribution and version control
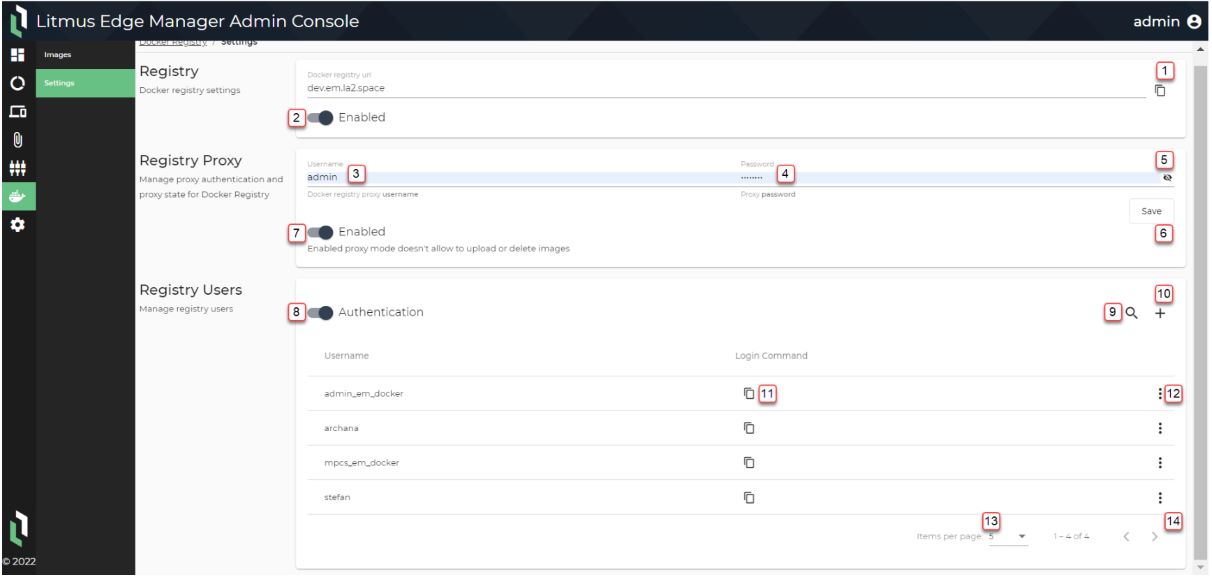
Tightly control your Docker applications from the same platform that you use to manage the devices on which these applications run. Use our platform’s Docker module to make the Litmus Edge Manager platform operate as a Docker registry.
Efficient Data Modeling and Digital Twins
Centralized Digital Twin Management
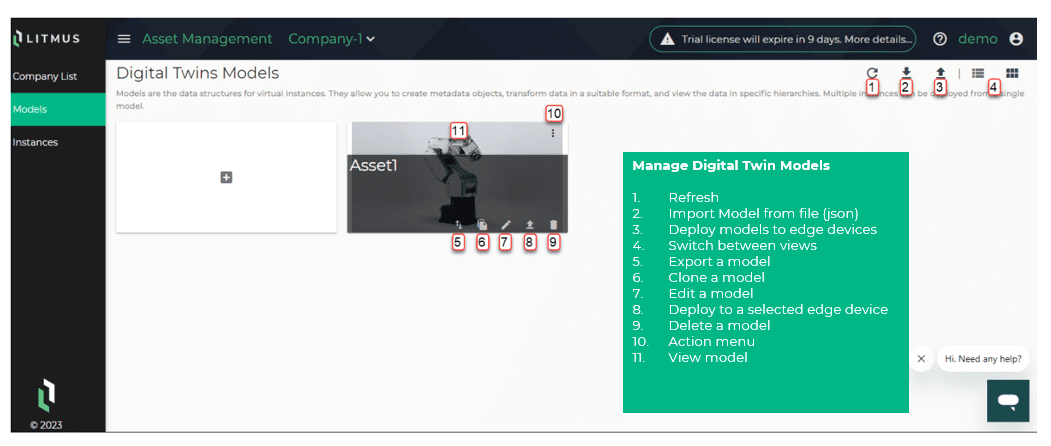
A digital twin is a visual representation of any industrial asset – an industrial machine, a site or a programmable logic controller (PLC). Data models are core to Litmus Edge as a foundational data layer to help you do more with data. Using Litmus Edge Manager, you can create, maintain and update your digital twin data models at an enterprise level. Once you are ready, you can deploy them at any or all your sites. Talk to our experts to see how Litmus Edge Manager can significantly optimize your cloud usage by deploying digital twins from a centralized platform.
Easier Enterprise-Level Machine Learning
Machine Learning Orchestration
Create a centralized repository of machine learning models accessible to any production line or site. Containerize machine learning models, deploy them to any number of sites and make updates for continuous learnings.
Step-by-Step Platform Demo
- Take a sneak peek of our platform architecture.
- Listen to our experts as they geek out on the features customers have asked for.
- Watch them put prebuilt drivers, workflows and solutions to work and how easy it is.
Look Under the Hood
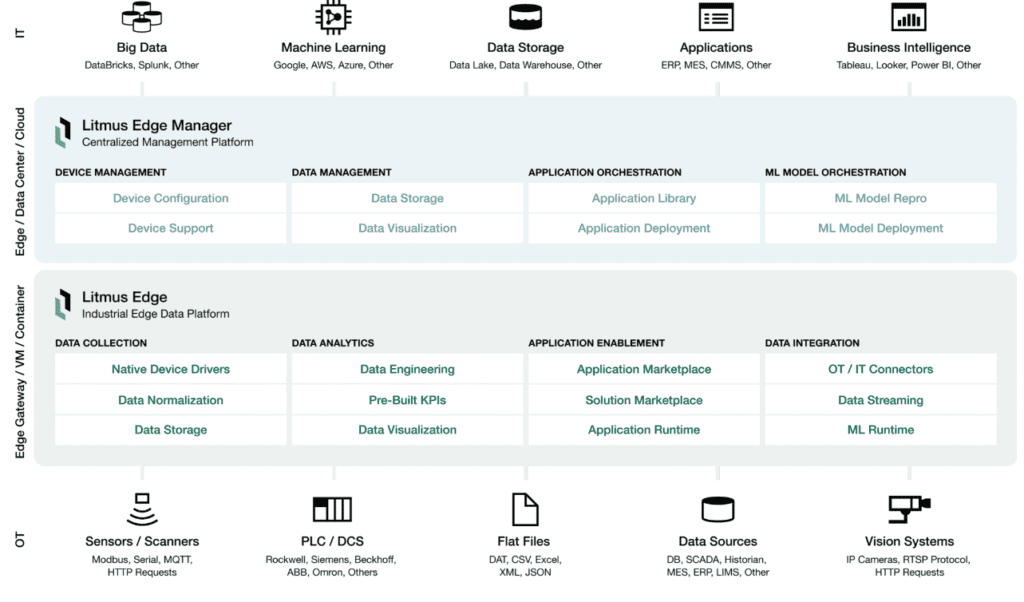
Litmus Edge provides you with a one-stop shop to implement and maintain all your Industry 4.0 use cases. To prepare for scaling and as you scale, Litmus Edge Manager adds a management and orchestration layer for device, data, application and ML model management. Together, they ensure scale, repeatability and efficiency to drive business growth.
Pick Your Own Deployment Model
On-Premise
Deploy your centralized management instance on-premise along with your Litmus Edge instances. An ideal model if you want your local IT team to have tighter control of the deployment as well as its management
- Run as an OS on a virtual machine or in a private data center or micro data center at the plant.
Cloud
Use your preferred cloud provider to host and deploy Litmus Edge Manager. Run it inside your own private tenant, under your own subscription. An ideal model for an enterprise IT team to manage.
- Unify your enterprise operations for easier management.
- Bill and transact through GCP, Microsoft Azure, or AWS marketplaces.

